Benchmark athletes within a selected squad
Read each athlete’s percentile on up to six metrics against the athletes you selected, with a profile radar and Elite-to-Needs-work bands.
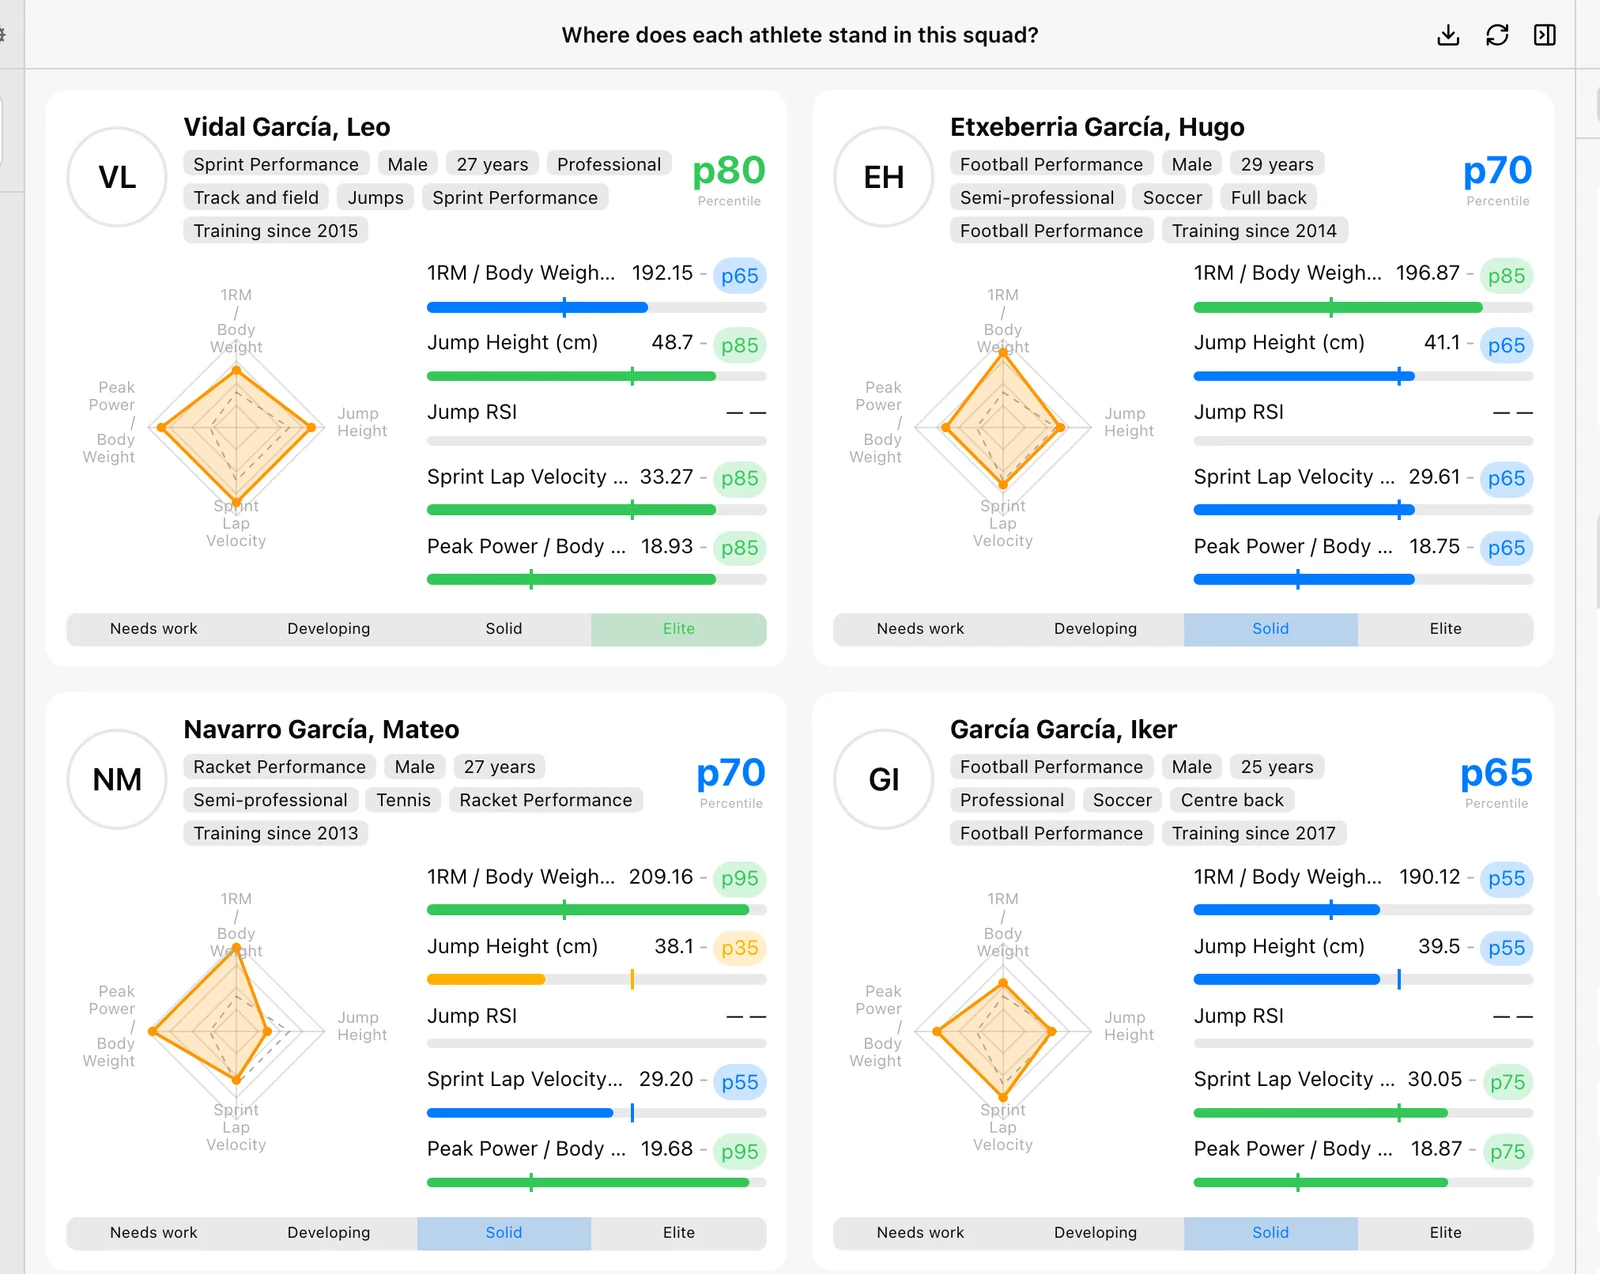
Benchmarks answers “Where does each athlete stand in this squad?” Every athlete gets a card with a percentile on each metric, an overall percentile, and a radar of their profile.
Open Labs → Reports → Benchmarks. It also works on narrower screens.
Choose the reference group
The percentiles are read against the athletes selected in Setup, nothing else. Narrow the selection and the whole board re-reads against it.
- In Setup, choose Date, the team or athletes, and any athlete filters.
- Under Metrics, add up to six metrics with their calculation and exercise. Three or more draw the radar.
Not an external norm
A percentile here is not a comparison with all Vitruve users, a population norm, or a published standard. Change the squad and the percentiles change, even if the athlete’s own value stays the same.
How percentiles are computed
For each metric, an athlete’s percentile is the share of measured athletes they beat, counting ties as half. For lower-is-better metrics, such as sprint times, it is flipped so a higher percentile is always better.
- Overall percentile (the big pNN on the card) is the mean of the athlete’s available metric percentiles.
- Bands: Elite (75 and above, green), Solid (50–74, blue), Developing (25–49, amber), Needs work (below 25, red).
Read a card
Cards are sorted by overall percentile, highest first.
- Header: the athlete, their band, and their overall percentile.
- Radar: “This athlete” in orange over the “Selection average” dashed in grey, on a 0–100 scale. It needs three or more measured metrics; otherwise the card says “No profile to draw”.
- One row per metric: the value and a colored percentile pill. Hover the pill for “Percentile NN within the selection”, or “Not measured in this window”. Hover the name for the calculation and the squad average.
- Track: under each row, a bar filled to the athlete’s percentile, with a tick where the selection average falls.
- Chips: teams and profile details such as sex, age, level, sport, position, squad, and training age.
Missing values are not zeros
An athlete with no value on a metric gets — for it and no standing on that axis. An athlete measured on none of the metrics gets no card; a note says how many. If a metric fails to load, a warning lists it and it is left off every card.
Presets
| Preset | What it profiles |
|---|---|
| Athletic profile | Strength, jump, reactivity, speed, and power on one radar. |
| Deadlift profile | Load, speed, power, force, and range. |
| Jump profile | Height, reactivity, and contact across both jumps. |
| Speed profile | Acceleration, top speed, total time, and reaction. |
| Workload profile | What each athlete actually did in the window. |
Export and empty states
Download CSV writes the overall percentile and, for each metric, the value, percentile, selection average, difference from average (absolute and %), reference percentile, and the number of athletes measured. Record the squad and window when you share it, so the percentiles stay interpretable.
- Pick what to benchmark: add metrics, and pick exercises where required.
- Nobody was measured in this window: widen the window, or pick metrics these athletes train.
Plot two metrics against each other
Use the Relationship report to place each athlete on two metrics, split the squad into quadrants at the medians, and read the fit line.
Investigate one athlete with Insights
How Insights pages work, how to pick the athlete, exercise, and period, and which of VBT, Sprint, Jump, and Reaction answers your question.