Analyze wellness, sleep, and wearable data in Labs
Combine training data with wellness scores, injuries, and wearable health metrics such as sleep, heart rate, body, and nutrition in Labs boards.
Labs reads more than bar velocity. Alongside training, its metric picker offers wellness and effort values recorded in Vitruve and health metrics from connected wearables or manual entry. Use them to see whether athletes are recovering from the load you prescribe.
Get health data into Vitruve first
Health metrics come from three places:
- Wearable integrations: each athlete connects their device in Settings → Integrations → Import. Providers can include Garmin, Whoop, Oura, Fitbit, Polar, Withings, Apple Health, Google Fit, and Health Connect, depending on platform and plan. See Integrations.
- Wellness questionnaires, injury reports, and workout RPE recorded in Vitruve. See Wellness and Injury reports.
- Manual measurements, such as body weight from the athlete’s profile or values entered in Scoresheet.
Labs only shows what was actually recorded and synced. Not every wearable supplies every category; sleep data, for example, usually comes from a wearable.
Health metrics you can analyze
| Category | Example metrics |
|---|---|
| Physical activity | Active time, steps, calories burned, VO2 max |
| Body | Weight, height, BMI, body temperature, body composition |
| Sleep | Sleep duration, light/deep/REM sleep, sleep quality and efficiency |
| Heart | Resting, average, and maximum heart rate, HRV, oxygen saturation (SpO2) |
| Mental | Stress levels and duration, mood |
| Nutrition | Calories and macronutrient intake, hydration, blood glucose, basal metabolic rate |
| Training and wellness | Wellness score, workout RPE, sessions completed, sets, reps, tonnage, duration |
Search the metric picker by name. Body, sleep, heart, and nutrition metrics do not need an exercise.
Build a readiness board
- Open Labs → Reports → Comparison.
- In Setup, choose Date and the team or athletes.
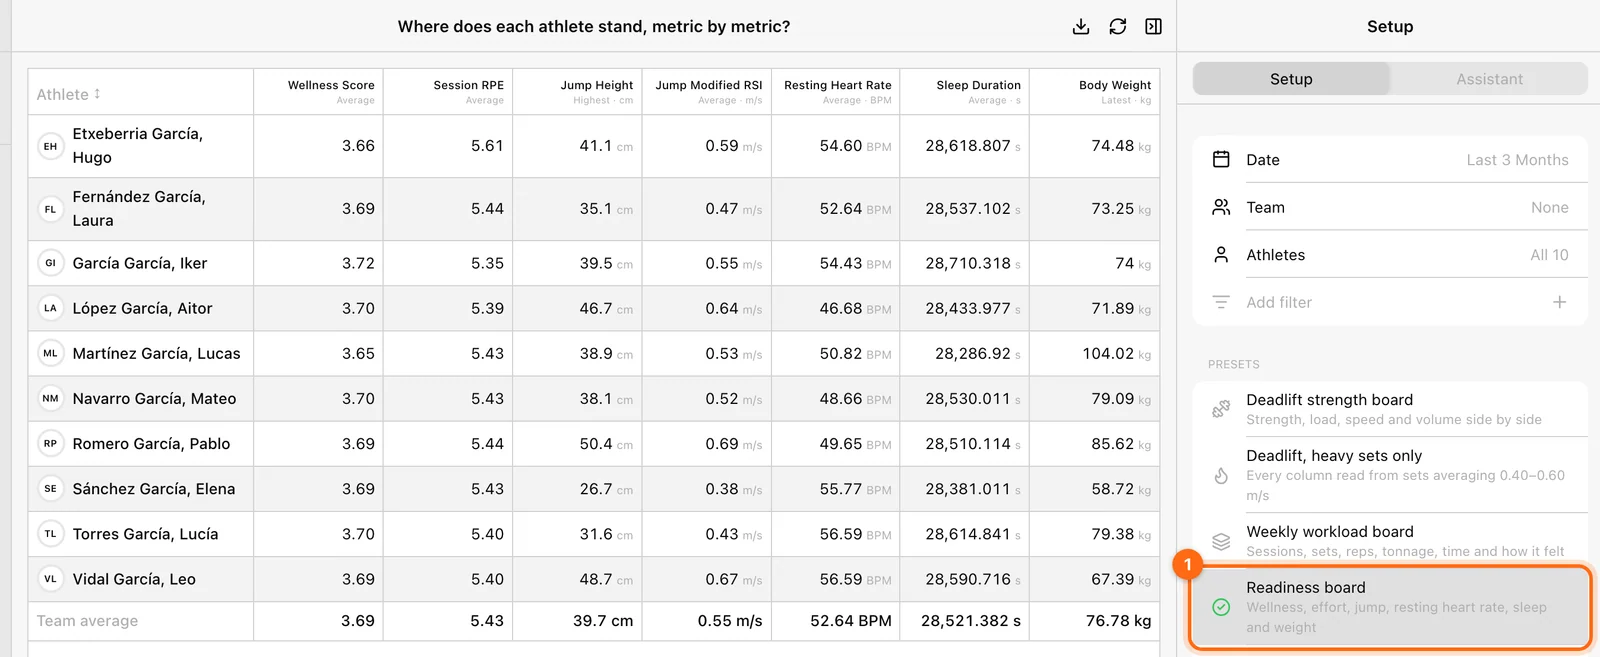
- Under Presets, apply Readiness board (wellness, effort, jump, resting heart rate, sleep, and weight).
- Adjust the columns: add or swap health metrics and choose each column’s calculation, such as Average for sleep or Latest for body weight.
- Read each athlete’s row and open their Profile when something stands out.
Other starting points: the Wellness preset in Trend, Wellness spread in Distribution, and Load vs readiness in Relationship, which shows who is carrying the volume and still feels well.
A low readiness reading is a prompt to check in with the athlete, not a diagnosis. Confirm unusual values with the athlete and the source device before changing their training.
If a health metric is empty
- Check that the athlete’s wearable is connected and has synced recent data.
- Confirm the provider actually supplies that metric.
- Widen the date window to include the measurements.
- Check that you selected the right athlete or team in Setup.
See Labs troubleshooting for other empty states.
Analyze reaction games with Reaction Insights
Follow an athlete’s reaction time, accuracy, and pace per game configuration, and check whether speed is coming at the cost of mistakes.
Dashboards
Put several Labs boards on one screen with a shared squad and window, arrange them, and understand autosave and who can see a dashboard.