Plot two metrics against each other
Use the Relationship report to place each athlete on two metrics, split the squad into quadrants at the medians, and read the fit line.
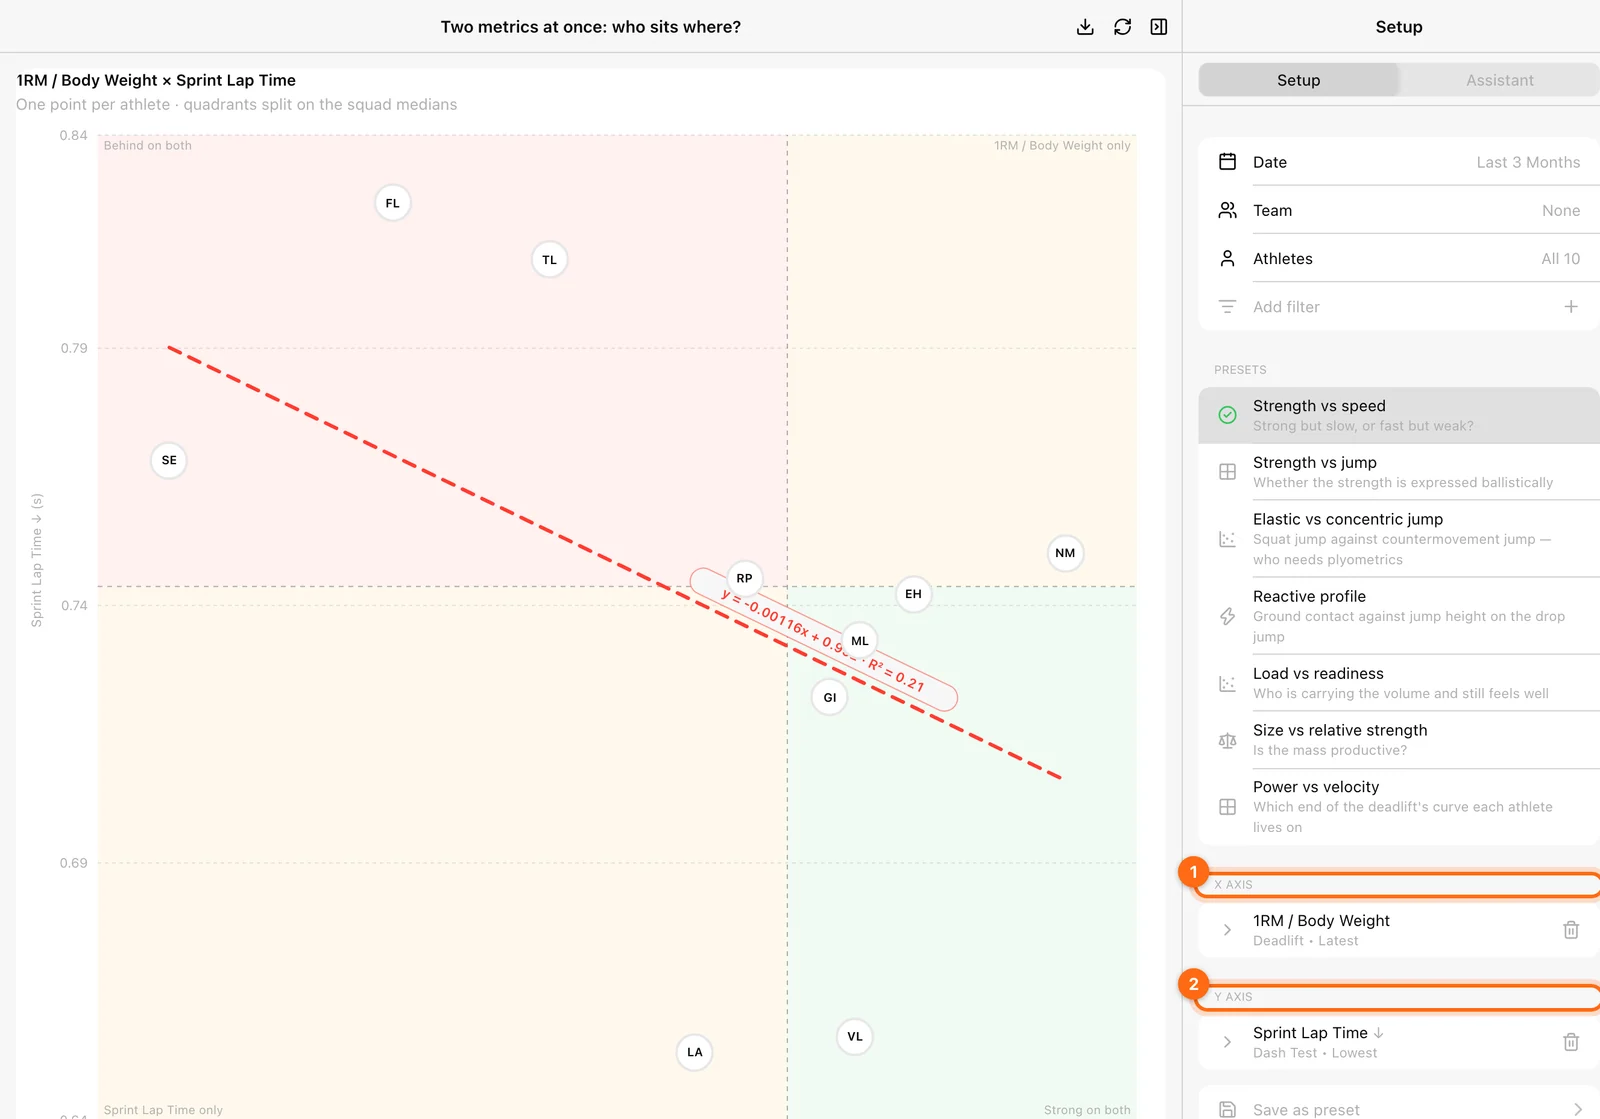
Relationship answers “Two metrics at once: who sits where?” Each athlete is a point placed by two metrics, such as strength against sprint speed. The squad is split into four quadrants, so you can see who is strong but slow, fast but weak, good at both, or behind on both.
Open Labs → Reports → Relationship. The board needs a window 1024 px or wider.
Set the two axes
- In Setup, choose Date, the team or athletes, and any athlete filters.
- Under X axis, select Add X metric. Under Y axis, select Add Y metric.
- Configure each axis on its own: Calculation, Exercise, and metric filters. One axis can read the deadlift while the other reads a sprint.
A new board plots deadlift 1RM per body weight (latest) against dash lap time (lowest).
Read the chart
- Points: each athlete appears as their avatar. Only athletes with a value on both metrics appear.
- Quadrants: dashed lines at the squad median of each axis split the chart. A value exactly on a median counts as the high side.
| Quadrant | Label | Color |
|---|---|---|
| Good on both | Strong on both | Green |
| Good on X only | [X metric name] only | Amber |
| Good on Y only | [Y metric name] only | Amber |
| Good on neither | Behind on both | Red |
“Good” follows each metric’s direction. For a lower-is-better metric (↓ after the axis title), a lower value is the good side.
- Fit line: with at least three athletes, a red dashed straight line shows the trend of Y against X, labelled with its equation and R². R² near 1 means the points sit close to the line; near 0 means the two metrics barely move together.
- Tooltip: the athlete and both values.
Association, not cause
A pattern in this chart is what this squad shows in this window. It does not prove that one quality causes the other.
Presets
| Preset | Question |
|---|---|
| Strength vs speed | Strong but slow, or fast but weak? |
| Strength vs jump | Is the strength expressed ballistically? |
| Elastic vs concentric jump | Squat jump against countermovement jump: who needs plyometrics? |
| Reactive profile | Ground contact against jump height on the drop jump. |
| Load vs readiness | Who is carrying the volume and still feels well? |
| Size vs relative strength | Is the mass productive? |
| Power vs velocity | Which end of the deadlift’s curve each athlete lives on. |
Export and empty states
Download CSV writes each athlete’s quadrant and both values, plus the medians, the correlation, R², and how many athletes were measured.
- Choose two metrics to plot against each other: set both axes.
- Choose an exercise for these metrics: pick the exercise under the axis that needs it.
- No athlete has a value on both metrics in this window: widen the window, or check that the same athletes did both.
See how spread out the squad is
Use the Distribution report to place every athlete on one metric, grouped into segments around the squad mean or median.
Benchmark athletes within a selected squad
Read each athlete’s percentile on up to six metrics against the athletes you selected, with a profile radar and Elite-to-Needs-work bands.