Analyze a lift with VBT Insights
Read an athlete’s load–velocity profiles, build and save an automatic profile, judge sets against a band, check daily readiness at a fixed load, and compare repetition curves.
VBT Insights read one athlete in one lift, recorded with a Vitruve encoder. Open Labs → Insights → VBT, pick the athlete, then choose the Exercise and Period in Setup. See Investigate one athlete with Insights for how athletes, exercises, and periods work.
The four tabs share the exercise and period; every other setting is the tab’s own.
| Tab | Question |
|---|---|
| Load–velocity profile | What do the athlete’s profiles look like, how are they evolving, and what profile does this period support? |
| Metrics | How does any VBT metric spread per set and load, and does each set stay inside a band? |
| Load & state | How fast does the athlete move a fixed load today against their baseline? In which velocity zones did training land? |
| Repetitions | How does the bar move through each rep? |
Velocities are always shown in m/s. Loads and range of motion follow your units.
Load–velocity profile
This tab has three sections, from top to bottom.
Profiles comparison
Compares two of the athlete’s saved profiles (equations) for this exercise.
- In Setup, under Saved profiles comparison, choose the Metric: mean velocity (MV), mean propulsive velocity (MPV), or peak velocity (PV). It defaults to the exercise’s own metric: PV for Olympic weightlifting lifts, MV otherwise.
- Choose Current and Baseline. They default to the newest profile and the one before it.
The chart draws each profile as a line: solid over the loads it was built on, dashed out to zero load and to its 1RM. The Parameters table lists, for each profile:
| Column | Meaning |
|---|---|
| V0 | Velocity the line reaches at zero load. |
| L0 | Load the line reaches at zero velocity. |
| Slope (m/s per 100 kg) | How much velocity drops for each 100 kg added. |
| 1RM | The 1RM the profile was saved with. |
| R² | How closely the lifts fit the line. |
What changed compares Current against Baseline on the lighter and heavier ends of the loads both profiles share, and gives one verdict: Better across the whole range, More efficient at heavy loads, More efficient at light loads, Slower across the whole range, Slower at heavy loads, Slower at light loads, or No relevant change. A difference counts only beyond the Smallest relevant change of ±0.04 m/s. If the profiles share less than 10 kg of load, the comparison is partly extrapolated and the footnote says so.
“No saved profiles” means none exists on this metric for this exercise. If some exist on another metric, the message says how many; change the metric in Setup.
Automatic profile evolution
One automatic profile is built every four weeks from those four weeks, plus one for each test session (four or more loaded sets at four or more loads, none over three reps). Use the toggle to follow 1RM, V0, or L0 over time. Only reliable (● grade A) and usable (○ grade B) profiles are drawn; tests are ◆. The shaded band is your selected period.
Automatic profile generation
Builds a profile from the selected period, ready to save.
How it is built
- Every set of the exercise in the period counts, warm-ups included.
- Sets are grouped by day and load. Of all the reps at that load that day, the fastest on the chosen metric becomes one point.
- A straight line is fitted through the points. It is a profile only if it reaches the Minimum distinct loads, Minimum velocity range, and Minimum R², and velocity falls as load rises. Clearing all three with margin reads as Reliable; just clearing them, Usable with caution.
- The 1RM is never typed: it is the load where the line reaches the Threshold velocity (1RM).
Tune these under Automatic profile in Setup:
| Setting | Default | Range |
|---|---|---|
| Metric | Exercise’s own metric | MV, MPV, PV |
| Threshold velocity (1RM) | The exercise’s study-based value (for example 0.14 m/s for deadlift, 0.18 for bench press, 0.32 for back squat), else 0.25 m/s | 0.05–1 m/s |
| Minimum distinct loads | 3 | 2–8 |
| Minimum velocity range | 0.4 m/s | 0.1–1.2 m/s |
| Minimum R² | 0.9 | 0.5–0.99 |
These thresholds are starting values. Restore default values resets this group only.
Refine the points. Click a point on the chart, or untick In the fit in the table, to take it out of the fit; click again to put it back. Use Rep used to read a point on another rep of that load and day. Back to the automatic points undoes your changes.
The stats show Points, Distinct loads, Velocity range, R², Quality, and Estimated 1RM. When the fit fails, each reason is listed with ✗. If loads or range are short, logging one or two light warm-up sets (about 40–60 % of 1RM) usually unlocks it.
Save it. Enter a Name (it defaults to “Automatic profile” and the period’s end date) and select Save profile. The profile is saved as the athlete’s active equation for that exercise, so it drives that athlete’s 1RM estimate from then on. It appears on the Equations page and in Profiles comparison above.
Saving changes the active equation
Check the quality, R², and estimated 1RM before you save. To go back, select the previous equation on the Equations page.
Metrics
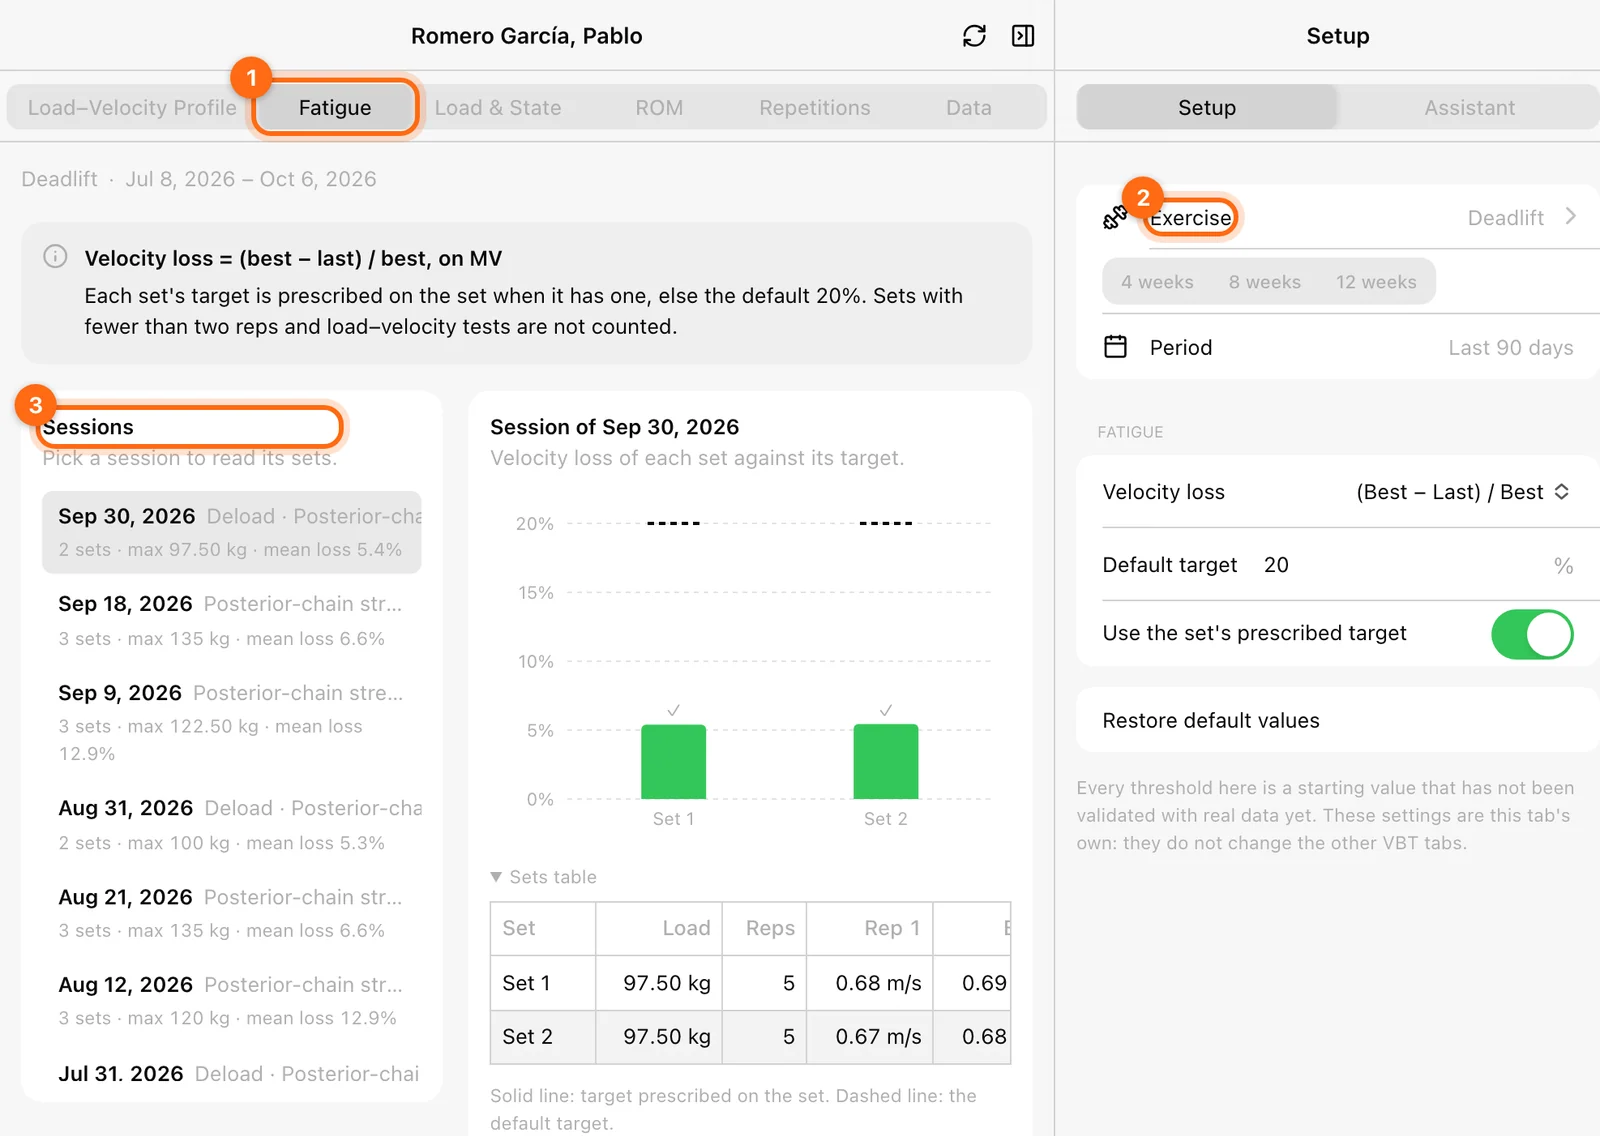
Reads any VBT metric per set, how it spreads at each load, and whether each set falls inside a band you define. It replaces the older Fatigue and ROM tabs.
Set it up
- Metric: Velocity loss (default), MV, MPV, PV, mean and peak power, range of motion, or any other VBT repetition metric.
- Each set is its: Mean of the reps (default), Best rep, First rep, or Last rep. Not used for velocity loss.
- Velocity loss: (best − last) / best (default) or (first − last) / first. It is read on MV, or PV for Olympic lifts. Sets with fewer than two reps and load–velocity tests are left out.
- Valid band: a Lower bound and/or Upper bound. Without a bound, sets are only read, not judged.
Read it
- Summary: the mean over all sets, the Spread (± percentage points for velocity loss, Coefficient of variation otherwise), and how many sets are Outside the band.
- Spread at each load: every set is a dot at its load. A circle is inside the band, a red cross outside. The bar runs from the lowest to the highest set; the diamond is the median. The table gives sets, mean, median, spread, quartiles, and range per load.
- Session: choose a session to see it set by set. For velocity loss, a line across each bar marks your upper bound.
- Per session: each session’s mean, with its lowest and highest set.
When you read Range of Motion, a warning appears if the median range is more than 2 cm shorter at heavy loads (above 85 % of the estimated 1RM) than at lighter ones. A shorter range at heavy loads inflates velocity, and with it the estimated 1RM.
Load & state
Readiness at a reference load
Readiness compares the fastest rep at one fixed load in each session with the athlete’s recent baseline at that load. It is a daily-state indicator, not a strength test.
- Reference load: Most repeated (automatic) picks the load lifted in the most sessions of the period. You can choose another one.
- Velocity: MV (default), MPV, or PV (default for Olympic lifts).
- Sessions in the baseline: how many earlier sessions at that load are averaged (default 6, range 3–15). The baseline can reach back before the period.
- “Normal” band: how far from the baseline still counts as normal (default ±0.03 m/s).
Each session reads Above normal (faster than the baseline by more than the band), Below normal, or Within normal. A session needs three earlier sessions at the same load to have a baseline. The chart colours each session green, red, or grey, with the baseline dashed and the normal band shaded.
Velocity zones
Counts the period’s reps per week in five zones: Very slow, Slow, Medium, Fast, and Very fast. Limits default to 0.50 / 0.75 / 1.00 / 1.30 m/s for MV and MPV, and 1.50 / 1.80 / 2.10 / 2.40 m/s for PV; change them under Zone limits. The header gives the share of reps in the two slowest and two fastest zones. Test sessions are left out. Zone limits are a coaches’ convention, not a scientific standard.
Repetitions
Overlays up to six repetition curves from the encoder’s raw signal through the concentric phase.
- In Setup, choose the First chart and Second chart: Velocity, Power, Force, Acceleration, or Range of motion (defaults: velocity and power).
- On the board, choose the Comparison:
- Different loads: the fastest rep at each load of one session (defaults to the latest test).
- Same load, different sessions: the fastest rep at one load across the last six sessions that lifted it.
- Reps of one set: every rep of one set.
- Choose X axis: % of range (default) or Time.
Curves go from light (first) to dark (last). Filled dots mark each curve’s power peak; hollow dots mark its first sticking point, a dip in velocity. Force and power use the bar’s mass only, so compare curves with each other rather than reading them as absolute values.
If a rep was recorded without its raw signal, the tab shows “No raw signal for these repetitions”. Try another session, load, or set.
Investigate one athlete with Insights
How Insights pages work, how to pick the athlete, exercise, and period, and which of VBT, Sprint, Jump, and Reaction answers your question.
Analyze sprints with Sprint Insights
Read an athlete’s times on every stretch of track, compare runs gate by gate, and check how steady they are across repeats.