Compare athletes metric by metric
Use the Comparison report to read up to twelve metrics side by side for a squad, color the best and worst values, and export the table.
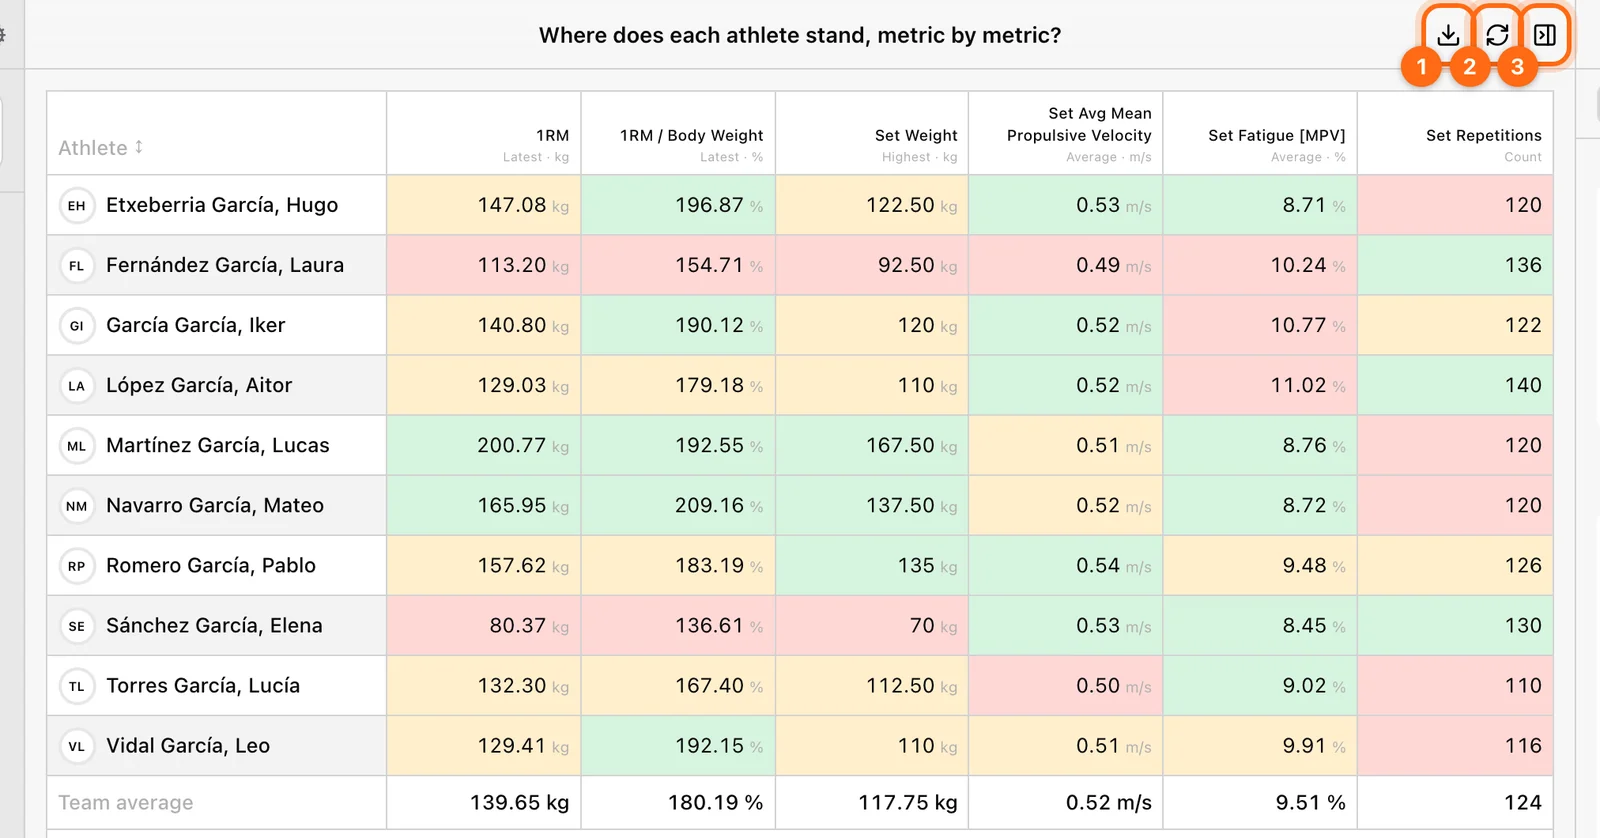
Comparison answers “Where does each athlete stand, metric by metric?” It is a table with one row per athlete and one column per metric. Use it for a testing-day board, a weekly workload check, or a readiness sweep before training.
Open Labs → Reports → Comparison. The board needs a window 1024 px or wider.
Build the table
Choose the athletes and window
In Setup, set Date, Team or Athletes, and any athlete filters. See Set up a Labs board.
Add the metric columns
Under Metrics, use Add metric for each column, up to twelve. Each column has its own Calculation, Exercise, and metric filters, so one column can read the latest 1RM while the next reads the average velocity of heavy sets only. Changing one column never changes the others.
Choose a highlight
Highlight colors each column independently:
| Option | What it colors |
|---|---|
| Max/Min | Scales the column from its worst to its best value: the best third is green, the worst third red, the middle amber. If every value is equal, all are amber. |
| Average | Green when a value beats the column’s average, red when it falls short. |
| Median | Green when a value beats the column’s median, red when it falls short. |
| Disabled | No colors. |
Colors follow each metric’s direction. For a lower-is-better metric, such as a sprint time (marked ↓ after its name), the lowest value is green. Empty cells are never colored.
A new board opens with six deadlift columns (1RM, 1RM/body weight, heaviest weight, average set mean velocity, average set fatigue, and total set repetitions) and Max/Min highlighting. Swap the exercise if your squad does not deadlift.
Read the table
- Column header: the metric name, then its calculation and unit. A column that could not be read shows a red Failed label; hover it for the reason.
- Cells: the athlete’s value for that column over the window, or — when nothing qualified. Hover a cell for its full value.
- Team average: the footer row is the mean of the measured values in each column. Athletes without a value do not count as zero.
- Sorting: select a column header to sort. A metric column sorts best first, then worst first, then back to roster order. Empty values always go last. The Athlete column sorts A–Z.
The athlete name is not a link. To dig into one athlete, open their Profile or an Insight.
Start from a preset
| Preset | What it sets up |
|---|---|
| Deadlift strength board | Strength, load, speed, and volume side by side. |
| Deadlift, heavy sets only | The same columns, every one read only from sets averaging 0.40–0.60 m/s. |
| Weekly workload board | Sessions, sets, reps, tonnage, time, and how it felt. |
| Readiness board | Wellness, effort, jump, resting heart rate, sleep, and weight. See Health and readiness. |
| Speed board | Split, lap speed, total time, and distance covered. |
Export
Download CSV appears once the table has rows. The file follows the table’s current sort and holds, for each metric, the value, the date it was measured, the team average, and any error. The file name carries the board and the date window.
If the table is empty
“Nothing to compare yet” means no column is ready: add a metric, and pick an Exercise for any metric measured per exercise. A column whose block keeps opening in Setup still needs its exercise. For other blanks, see Labs troubleshooting.
Review an athlete profile
Read one athlete’s metric cards, their trend per exercise, how they rank against a group, and every new personal best in the window.
Follow a squad’s trend over time
Use the Trend report to see each athlete’s change per day, week, or month as colored percentage chips, with their latest value and their change across the window.