Run a load–velocity profile test
Plan and perform the four-load test that creates an RM equation, choose the 1RM velocity, judge the result's quality, and select the profile you train with.
A load–velocity profile (L-V profile), also called an RM equation, describes how fast an athlete moves different loads on one exercise. Vitruve uses it to estimate 1RM and to suggest loads from velocity. This guide covers the test session: planning the loads, recording them, and judging the result. For every field and message in the form, see Create equations and manage 1RM.
Before the test
- Pick one exercise, the exact variation you will train later.
- Pick one metric: Mean Velocity, Mean Propulsive Velocity, or Peak Velocity. Use the one you will follow in training. For example, a Power Clean is often profiled with Peak Velocity.
- In Coach Mode, select the athlete or athletes being tested. The form says Select at least one athlete to start the test until you do.
- Warm up as you would for a heavy session.
1. Open a new equation
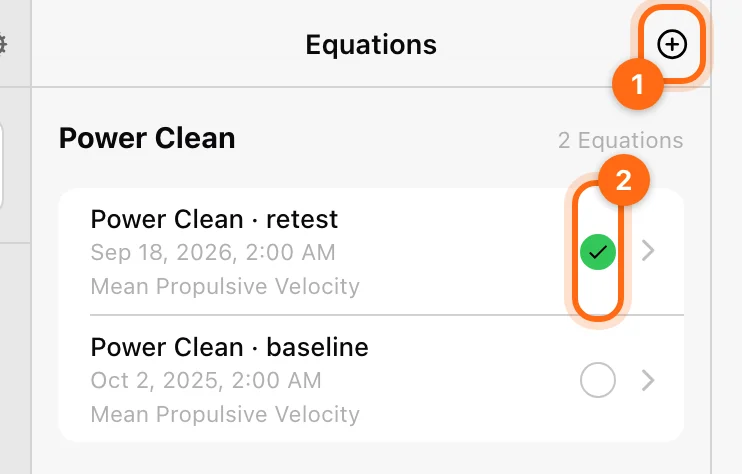
- Open Training → Equations. On mobile you can also use More → Equations.
- Select +.
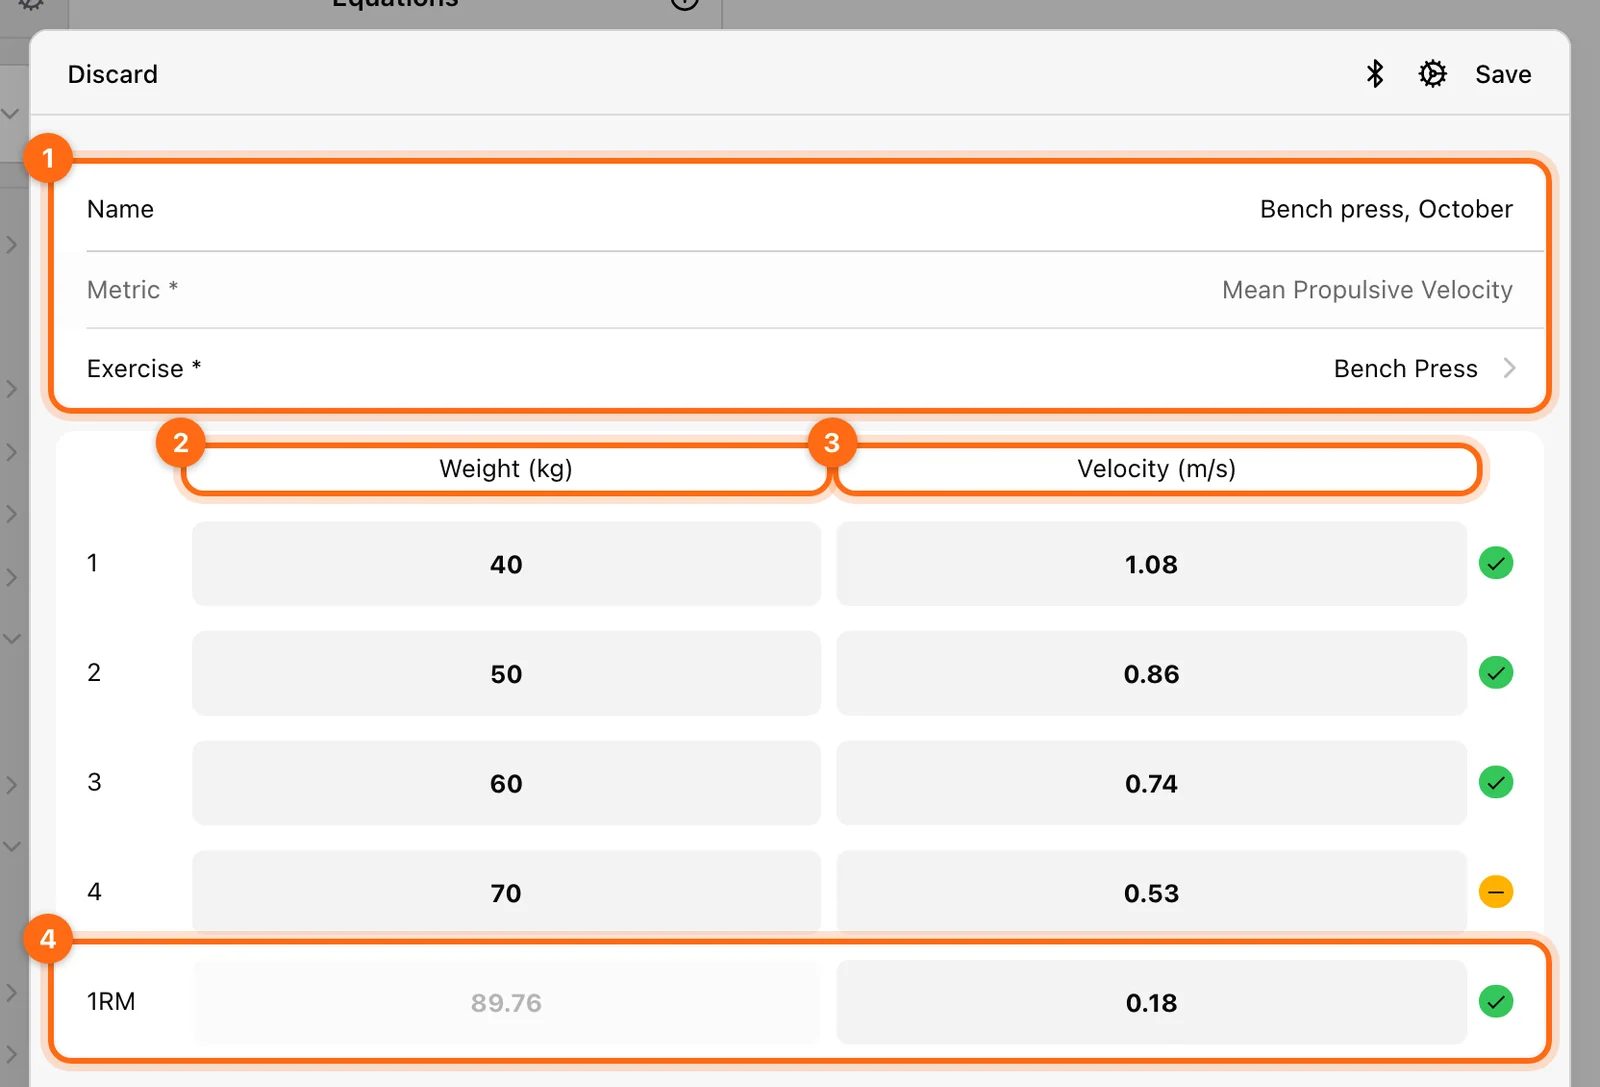
- Fill in the details:
- Name, for example "Back squat, January". A dated name helps when you have several profiles.
- Metric, for example Peak Velocity.
- Exercise to profile.
- Connect the encoder with the form's Bluetooth button if it is not already active. The cog opens training settings.
The form reminds you to perform an incremental test with 4 progressive loads, starting with a low weight of about 50–60% of your RM and increasing gradually.
2. Perform four progressive sets
Record four sets, each heavier than the last. A typical structure:
| Set | Load (% of 1RM) | Reps |
|---|---|---|
| 1 | about 50% | 3 |
| 2 | about 60% | 3 |
| 3 | about 70% | 3 |
| 4 | about 80–90% | 3 |
For each set:
- Select the row, enter the Weight in the displayed kg or lb unit, and lift.
- The row takes the best rep's velocity for the chosen metric. You can also type the velocity in.
- Check the row before moving on. Each load must be heavier than the previous one, and each velocity slower. Otherwise the form shows Weight must be greater than the previous one or Velocity must be lower than the previous one.
Give full effort on every rep. A deliberately slow rep makes the profile wrong.
3. Set the 1RM velocity
The last row holds the 1RM velocity: how fast the bar moves at a true one-rep max. This value matters a lot, because the app extends the profile down to it to calculate the estimated 1RM.
The app fills in a value for the exercise, based on published VBT research:
| Exercise | Default 1RM velocity |
|---|---|
| Deadlift, Romanian Deadlift, Sumo Deadlift | 0.14 m/s |
| Bench Press | 0.18 m/s |
| Standing Military Press | 0.20 m/s |
| Pull-Ups | 0.22 m/s |
| Barbell Hip Thrust | 0.24 m/s |
| Back Squat, Low Bar Back Squat, Front Squat | 0.32 m/s |
| Bench Pull, Barbell Row | 0.53 m/s |
| Any other exercise | 0.25 m/s |
If you do not trust the default for this athlete or exercise, you can find the real value in one of these ways:
- Perform a true 1RM lift and record its velocity.
- Take a set to failure and use the last rep's velocity as the threshold.
- Use the value from a similar exercise as a reference.
4. Review the quality and save
Once all rows are filled, the form shows the profile chart, its R², and a quality label:
| Label | R² | What to do |
|---|---|---|
| Perfect equation | exactly 1 | Good to go. |
| Almost perfect equation | above 0.97 | Good to go. |
| Improvable equation | between 0.94 and 0.97 | Usable, but repeating the test is recommended. |
| Bad equation, repeat | below 0.94 | Discard and test again, checking load entry and effort. |
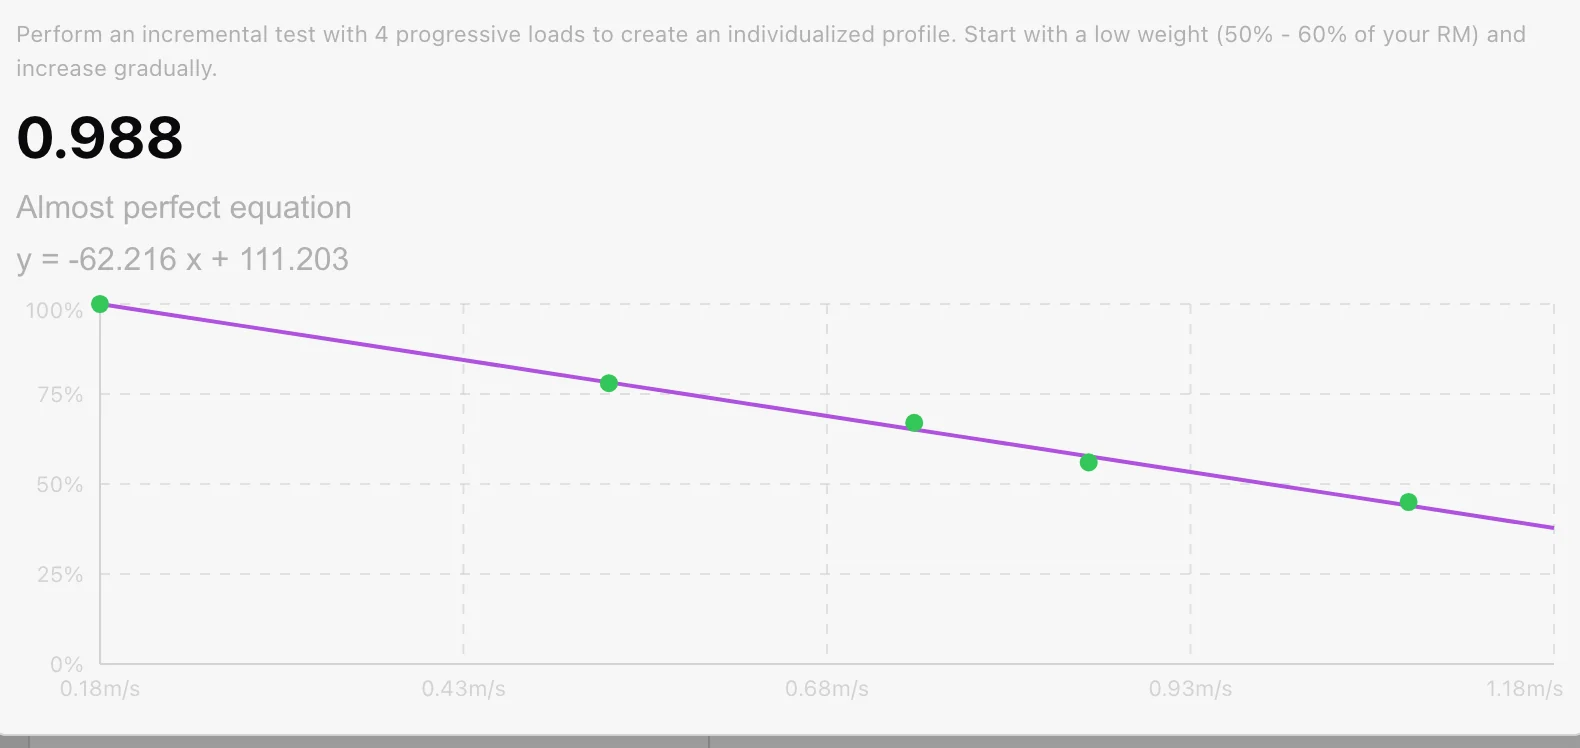
Select Save when you are satisfied. A newly saved equation is selected straight away. Discard throws away the unsaved test after you confirm. You cannot undo it.
5. Use and manage your profiles
- Your equation now drives the estimated 1RM for that exercise. See Estimate your 1RM during a training session.
- You can create several profiles for the same exercise, for example per training block or fatigue state.
- Only the selected profile is used. To switch, open Equations and select the green check next to the profile you want.
- The ten default equations stay available for their lifts. See Default equations.
Summary
| Action | Result |
|---|---|
| Create the equation | A profile for one athlete, exercise, and metric. |
| Record four progressive sets | The points that build the load–velocity line. |
| Check the 1RM velocity | The value that turns the profile into an estimated 1RM. |
| Save and select | The profile training uses for estimates. |
| Train | Live 1RM estimates and velocity-based load suggestions. |
Estimate your 1RM during a training session
See a live estimated 1RM while you lift, use the 1RM Calculator to pick a percentage load, and fix a missing or implausible estimate.
Review and correct work during a workout
Inspect sets and events, correct a load, remove a bad rep, use compatible copy/paste, and fix work recorded under the wrong athlete.