Build a Labs dashboard
Put several Labs boards on one screen with a shared squad and window, arrange them, and understand autosave and who can see a dashboard.
A dashboard puts several Labs boards on one screen, all reading the same athletes and window. Build one for a weekly staff meeting, a position group, or a return-to-play review.
Dashboards are saved to your account, so they follow you to any browser. They are private: other coaches cannot see your dashboards, and there is no sharing.
Create a dashboard
- Open Labs → Dashboards.
- Select +, enter a name (up to 60 characters), and select Create.
- The new dashboard opens, with no widgets yet.
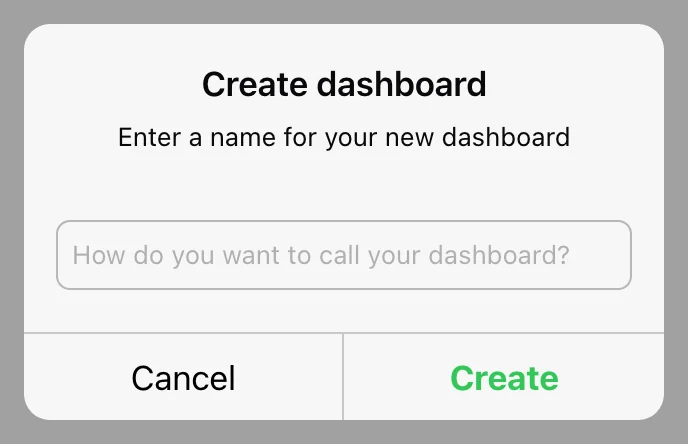
The list shows each dashboard with its number of widgets, most recently updated first.
Set the shared scope
Open Setup and choose Date, Team, Athletes, and athlete filters. Every widget reads this scope; widgets have no window or athletes of their own. A new dashboard starts on Last 7 Days and all athletes. Change the scope and every widget updates.
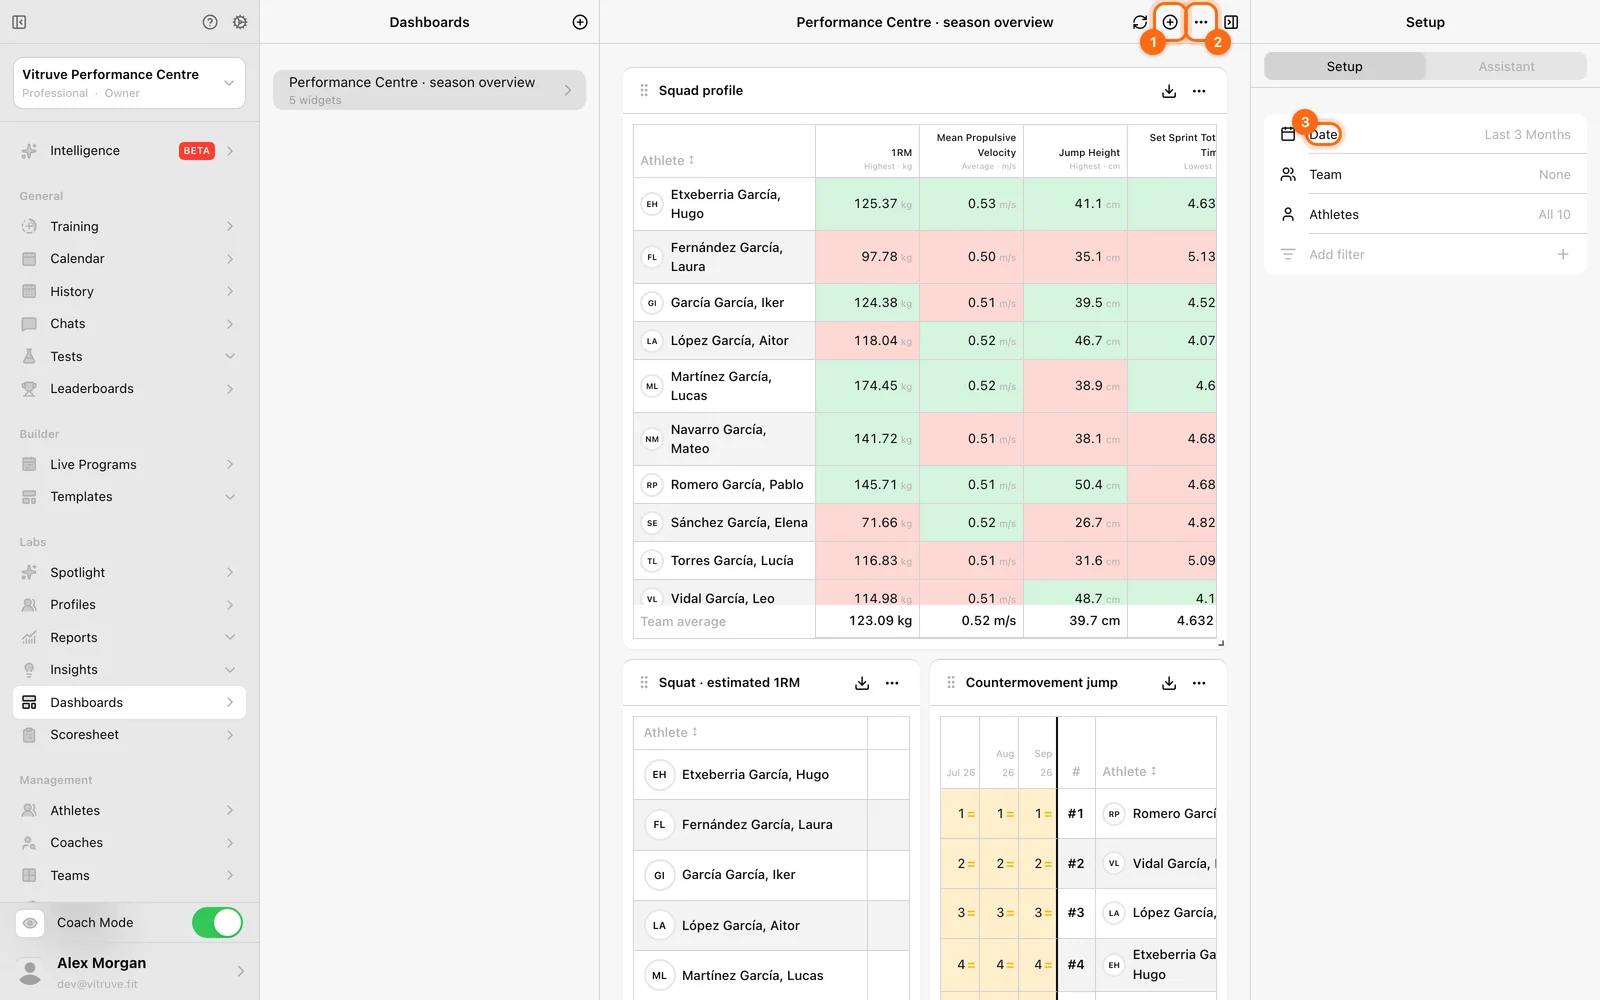
Add a widget
- Select Add widget.
- Under Board, choose one of the five types: Comparison, Trend, Ranking, Distribution, or Relationship.
- Configure it as you would the matching report: metrics, calculations, exercises, filters, and that board’s options. See Comparison, Trend, Ranking, Distribution, or Relationship.
- Check the live preview on the left, which already reads the dashboard’s scope.
- Adjust the Title if you like (it is named after the board and metrics until you type your own), then select Add.
Add appears once the widget is complete: every metric that needs an exercise has one, and the title is 1–80 characters. Switching the board type keeps the metrics that still fit.
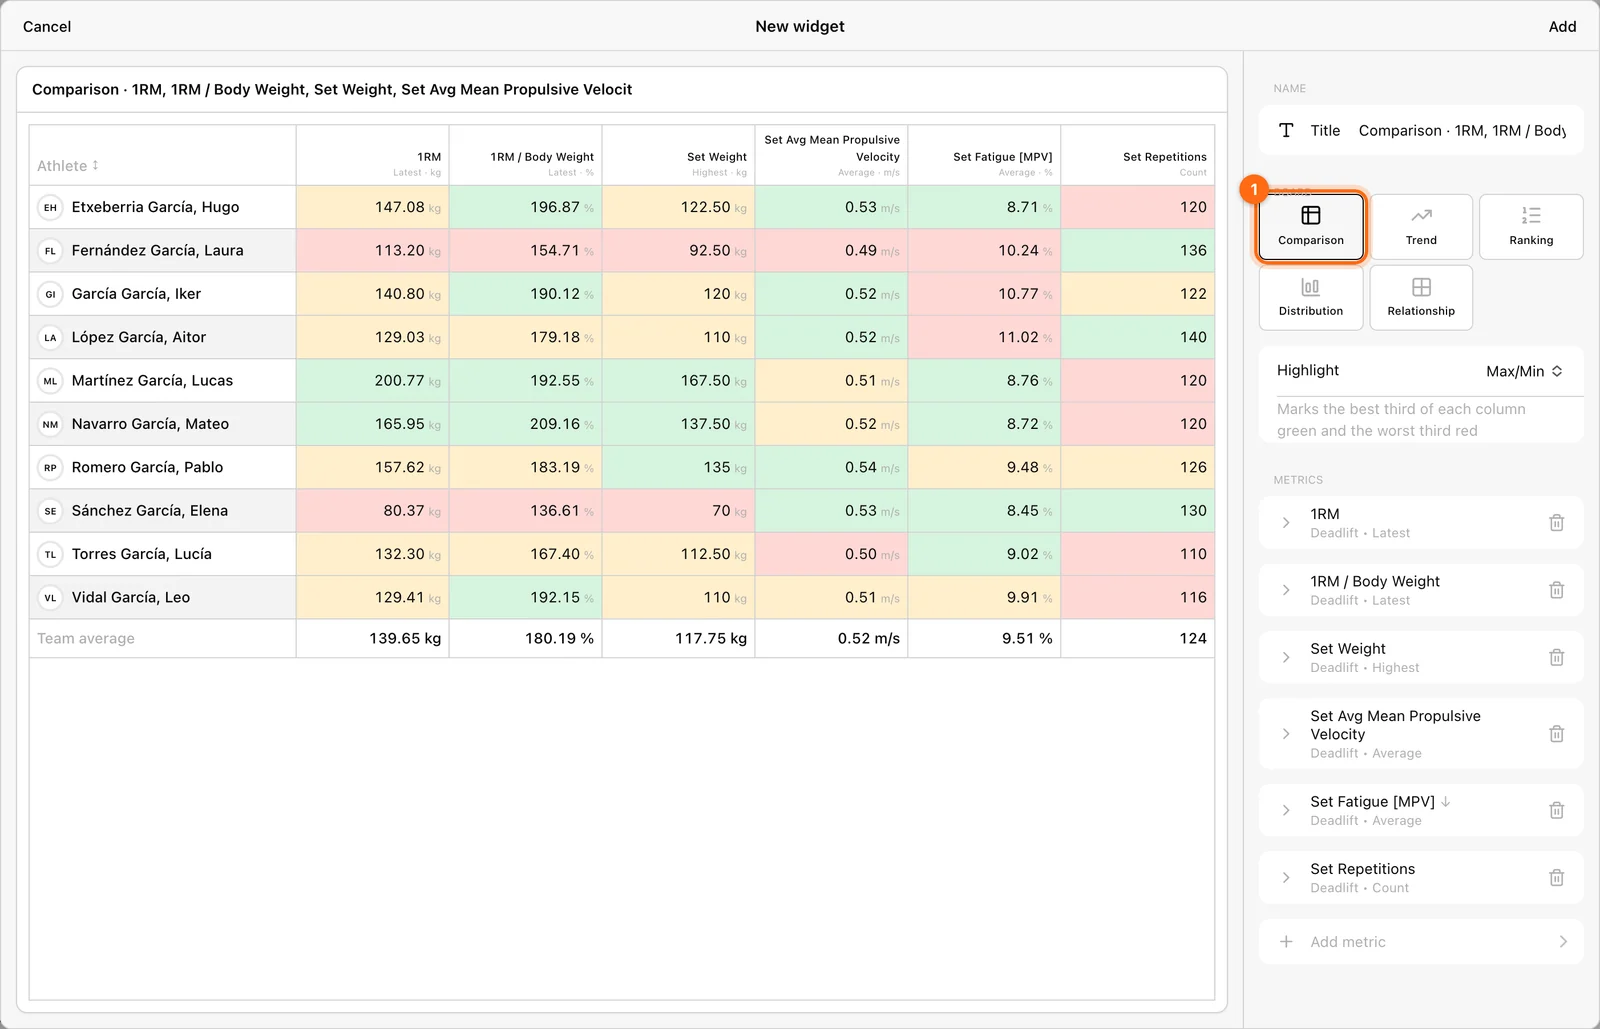
A dashboard holds up to 24 widgets. Each widget has a CSV button and a ⋯ menu with Edit and Delete.
Arrange the layout
- Move a widget by dragging its title bar.
- Resize it from its corner.
- New widgets are added at the bottom.
When the dashboard is narrower than about 600 px, widgets stack in one column and cannot be moved or resized; your saved layout is unchanged. Comparison, Trend, Ranking, and Relationship widgets need a window 1024 px or wider to draw.
Saving
There is no Save button: every change (layout, widgets, scope, name) saves automatically a moment later. If a save fails, a message says your changes are still on the page; check your connection and they will save with the next change.
If the same dashboard is open in two tabs or browsers and both change it, the server’s version wins and the other tab reloads it, discarding its unsaved edits. Edit a dashboard in one place at a time.
Rename or delete
Use Options (⋯) in the dashboard header:
- Rename changes the name.
- Delete asks for confirmation and cannot be undone.
Deleting a widget or a dashboard removes only the analysis setup, never the workouts or measurements behind it.
If a widget is blank
Check the dashboard’s scope first, then the widget’s own metrics and exercise. Other widgets showing data does not mean this widget’s exercise was recorded. See Labs troubleshooting.
Wellness, sleep, and wearables
Combine training data with wellness scores, injuries, and wearable health metrics such as sleep, heart rate, body, and nutrition in Labs boards.
Enter manual measurements with Scoresheet
Record test results by hand for many athletes at once, such as body weight or a tested 1RM, saved as manual measurements at one date and time.